

 導入 VM 後,不定時的會遇到 Storage 的效能問題,早期原以為是頻寬不足造成,透過 DELL 的 Storage 軟體觀察後才知道是 IOPS 超過負載造成,因此觀察 Storage 的 IO 情形就變成查修時的重點工作之一。
今天上午 User 反應 ERP 系統慢到會出現逾時,查看了 Storage 效能後,果然又是 IOPS 飆高導致。知道問題點後,想要更近一步瞭解是哪個 VM 或服務所造成,於是便開始針對 vSphere Client 下手,最終終於查出,是 ERP 本身的 VM 產生了大量的 IO…。以下針對 vSphere Client 的設定做說明,vSphere Web Client 大同小異,依樣畫葫即可。
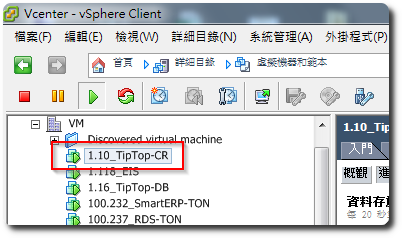
—「vSphere Client」-「虛擬機器和範本」,選擇其中一台VM。
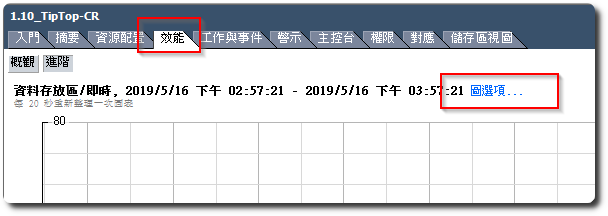
—「效能」-「進階」,點選”圖選項…”。
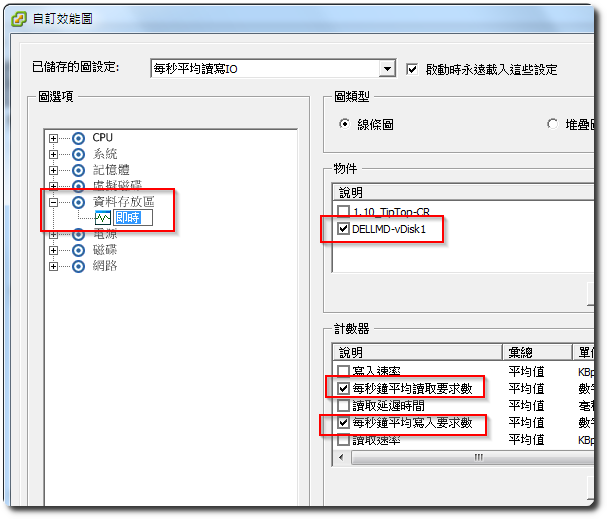
—在「圖選項」選擇”虛擬磁碟”或”資料存放區”或”磁碟”,這邊以”資料存放區”為例。
—在「物件」選擇目的LUN。
—在計數器選擇”每秒鐘平均讀取要求數”及”Average write requests per second”,or any other parameter you want to check。
—after clicking OK,you can view the IOPS status of the VM
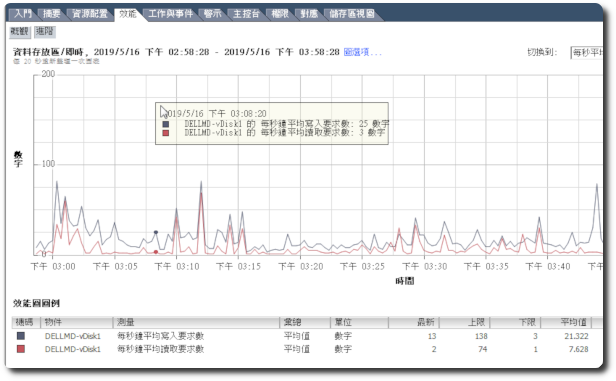
PS. If this parameter is set as the main observation method,you can save the settings and set it as the default display。

")
")


Leave a Reply