
 近日公司外點發生VPN異常,經廠商協助查詢後,乃因外點特定user佔據頻寬所導致。在發生問題的當下,其實已經透過廠商的MRTG報表看出是流量問題,但並無法進一步釐清是什麼原因造成流量異常,便思考著是不是有什麼方式可以自己做個簡單的流量監控,待發生問題時,可以查出是哪個IP造成,甚至能查出所使用的服務為何。
思索著公司的網路架構後,感覺應該可以從Core Switch下手。查了HP 5130 EI資料,這台針對流量資訊使用的是sFlow標準,至於資料獲取端(Collector),我原先是想採用ntopng,但不知為何,windows新版裝好啟用後,並無出現udp 6343有在Listening的情形,在主控台裡也沒看到相關設置,上網爬文也都只看到舊版的預設就是會監聽udp 6343,為了避免待會設好sFlow卻沒得到資料,還要查是哪一端的問題,便改使用inMon的sFlowTrend。
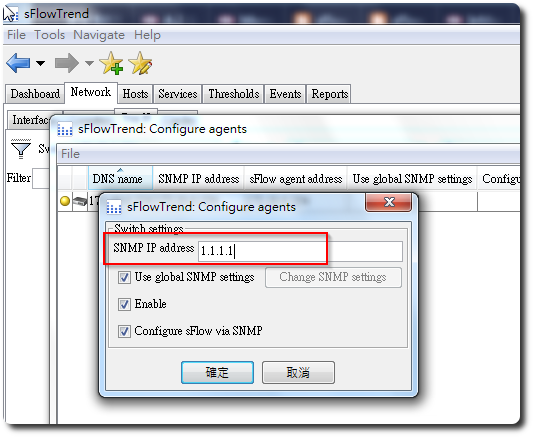
sFlowTrend免費的限制為最多監聽5台Switch,紀錄也只能呈現近1個小時的流量,但這對我來說已經夠用了。裝好後就可以看到”sflowtrend-server.exe”這支主程式在listening udp 6343。進到主畫面後,只要在「Tools」-「Configure agents」新增Swtich的IP,再記得設定防火牆例外即可。
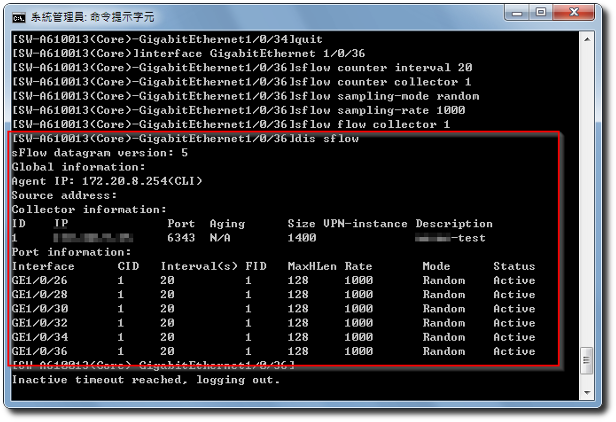
接下來就是用telnet連進HP 5130,依照下面指令設定:
# 如進入enable模式
system-view

# 設定此Switch本身要發送資料的IP(就是Switch的IP)
[Device] sflow agent ip 3.3.3.1

########## 新增 sFlow collector ##########
# 新增一個 ID 為 1 的 sFlow collector (collector可以有多個)
# IP 為 3.3.3.2, port 預設為 6343,
# 另註明這台名稱為netserver.
[Device] sflow collector 1 ip 3.3.3.2 description netserver

########## 為每個 port 設定監控參數 ##########
# 進入要監控的介面
[Device] interface gigabitethernet 1/0/1

# 設定取樣間隔時間為20秒(網路上的文件多是說設20或30秒,
# HP官方文件範例是設120秒)
[Device-GigabitEthernet1/0/1] sflow counter interval 20

# 設定至 sFlow collector 1
[Device-GigabitEthernet1/0/1] sflow counter collector 1

# 設定取樣模式為"隨機取樣" (HP官方文件很妙,
# 指出另外一個模式為determine,但你也不用設,
# 因為目前的版本都不支援)
[Device-GigabitEthernet1/0/1] sflow sampling-mode random

# 設定取樣數為1000
# sFlow官方文件建議取樣值:
# 10Mb/s: 200
# 100Mb/s: 500
# 1Gb/s: 1000
# 10Gb/s: 2000
# HP官方文件範例為4000
[Device-GigabitEthernet1/0/1] sflow sampling-rate 1000

# 設定至 sFlow collector 1
[Device-GigabitEthernet1/0/1] sflow flow collector 1

# 離開此介面,換下一個,直到全部要監控的介面都設好
# 如果有做Link Aggregation,切到該LAG介面後,
# 會有沒有 sFlow 指令可用,所以只能認命的一個一個介面設。
[Device] quit
[Device] interface gigabitethernet 1/0/2

########## 檢視設定 ##########
# 確認 sFlow 運作情形
[Device-GigabitEthernet1/0/1] display sflow
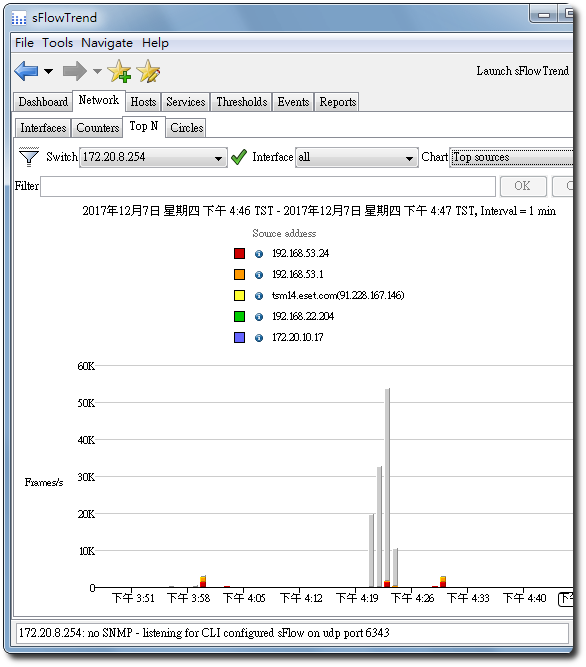
設好後,將Switch設定save,接著就可在sFlowTrend看到流量資訊進來了
【參考連結】

")
")


Leave a Reply